Home » Blog » Physical Therapist vs. Occupational Therapist

OT vs PT: What’s the Difference?

physical therapist helps senior man with walking
Home » Blog » Physical Therapist vs. Occupational Therapist
author default image

Written and reported by:
All Allied Health Schools Staff

Occupational therapist vs. physical therapist. Which career is right for you? Both do vital hands-on rehabilitative work to help patients with injuries or disabilities that limit how they’re able to move and function in daily life.

PTs work primarily with people recovering from injuries. The goal is to get patients back in motion with exercises, massage and other techniques, and therapy usually happens in a PT’s office. Physical therapy often focuses on preventing injuries, and it can help people avoid surgery or a long-term reliance on medications.

OTs help their patients perform day-to-day tasks, whether they’re recovering from injuries or have developmental or cognitive disabilities affecting their motor skills, emotions or behavior. Some occupational therapy might happen in a hospital or OT’s office, but a key component occurs in a patient’s home or work environment. Other OTs work in schools and help children develop skills to become functioning, independent adults.There’s a strong emphasis on the practical aspects of helping people do the things they want and need to do so they can live life to the fullest.
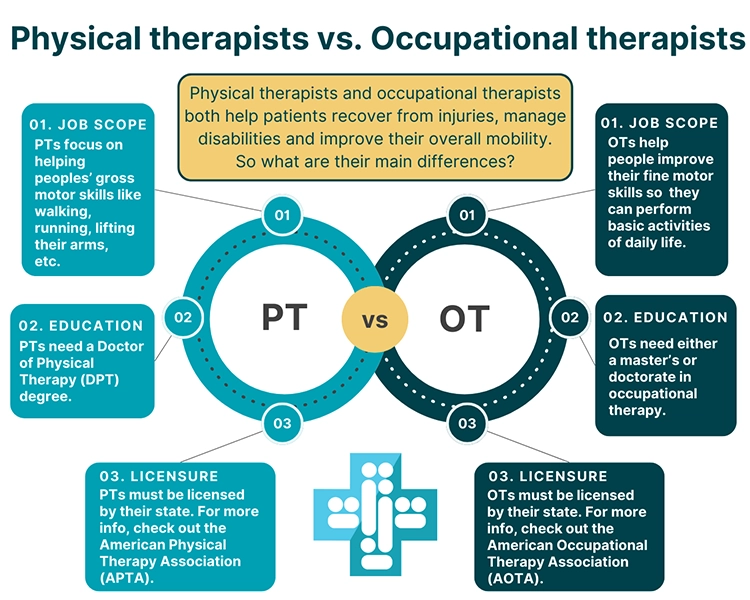
A Venn Diagram explaining the main differences between physical therapists and occupational therapists

The Key Differences

Here’s a comparison between occupational therapist vs. physical therapist professions:

Job Duties


Physical Therapists

  • Diagnose physical problems restricting movement because of an illness or injury
  • Use exercises and other techniques to ease pain and boost mobility and muscle strength
  • Develop fitness and wellness programs aimed at preventing injuries and encouraging a more active lifestyle

Occupational Therapists

  • Help patients with daily living skills and self-care tasks (i.e., “occupations”) such as getting dressed
  • Make recommendations about adaptive and accessibility equipment, such as ramps, wheelchairs, or gait trainers to patients, architects, and contractors
  • Support patients with memory loss or other cognitive issues

Education


Physical Therapists

Occupational Therapists

  • Most practicing physical therapists hold a doctorate, which can take about three years to complete. Master’s degrees take two years and both require an undergraduate degree.
  • Occupational therapists need at least a master’s degree to practice (two years). A doctoral degree takes between two and three years.

Licensing and Certification


Physical Therapists

Occupational Therapists

  • Physical therapists must be licensed. To sit for the National Physical Therapist Examination, you have to be a graduate of an accredited physical therapy school.
  • Licensing laws vary by state but common requirements include graduating from an accredited occupational therapy school, meeting fieldwork requirements, and passing a national certification exam.

Median Annual Salaries

Your education, years on the job, and location, can play a factor in how much you earn. Compare salaries for PTs and OTs below.

Physical Therapists

National data

Median Salary: $99,710

Projected job growth: 15.1%

10th Percentile: $72,260

25th Percentile: $81,970

75th Percentile: $113,630

90th Percentile: $130,870

Projected job growth: 15.1%

State data

State Median Salary Bottom 10% Top 10%
Alabama $96,700 $63,670 $131,700
Alaska $104,610 $83,890 $131,100
Arizona $98,510 $76,670 $125,740
Arkansas $93,880 $65,040 $124,800
California $115,550 $76,990 $154,170
Colorado $97,610 $71,110 $129,680
Connecticut $103,280 $76,230 $130,450
Delaware $102,470 $80,650 $131,560
District of Columbia $100,850 $82,960 $130,660
Florida $96,970 $56,470 $126,780
Georgia $99,890 $74,910 $125,590
Hawaii $101,780 $83,670 $125,520
Idaho $93,100 $72,380 $113,360
Illinois $102,820 $79,800 $130,760
Indiana $98,620 $66,760 $119,950
Iowa $92,200 $75,360 $111,630
Kansas $95,790 $65,560 $121,780
Kentucky $88,640 $45,100 $120,190
Louisiana $98,920 $61,930 $131,680
Maine $90,590 $75,370 $109,820
Maryland $102,020 $79,670 $130,220
Massachusetts $100,470 $75,010 $124,250
Michigan $99,220 $74,550 $117,740
Minnesota $96,560 $79,270 $112,370
Mississippi $96,430 $66,470 $122,860
Missouri $92,140 $63,240 $115,870
Montana $85,020 $65,590 $107,420
Nebraska $92,680 $67,440 $109,880
Nevada $104,000 $64,470 $179,550
New Hampshire $96,760 $77,960 $112,690
New Jersey $104,010 $80,850 $133,790
New Mexico $100,450 $58,650 $134,320
New York $97,780 $63,910 $131,520
North Carolina $94,830 $72,560 $118,320
North Dakota $88,250 $68,460 $108,680
Ohio $98,440 $73,860 $127,000
Oklahoma $98,090 $66,340 $122,030
Oregon $101,000 $76,960 $127,300
Pennsylvania $100,240 $73,200 $124,950
Rhode Island $95,490 $74,980 $131,010
South Carolina $97,280 $65,820 $118,660
South Dakota $89,290 $69,560 $103,480
Tennessee $98,690 $76,570 $118,390
Texas $104,060 $72,830 $137,350
Utah $95,000 $59,790 $135,780
Vermont $90,860 $73,920 $112,260
Virginia $96,780 $72,550 $129,840
Washington $100,950 $75,340 $131,130
West Virginia $96,210 $64,010 $124,310
Wisconsin $97,670 $75,820 $118,250
Wyoming $88,290 $67,400 $121,630

Source: U.S. Bureau of Labor Statistics (BLS) 2023 median salary; projected job growth through 2032. Actual salaries may vary depending on location, level of education, years of experience, work environment, and other factors. Salaries may differ even more for those who are self-employed or work part time.

Occupational Therapists

National data

Median Salary: $96,370

Projected job growth: 11.5%

10th Percentile: $65,210

25th Percentile: $79,290

75th Percentile: $109,480

90th Percentile: $129,620

Projected job growth: 11.5%

State data

State Median Salary Bottom 10% Top 10%
Alabama $95,340 $69,240 $123,690
Alaska $103,180 $45,210 $139,430
Arizona $95,020 $51,710 $122,110
Arkansas $95,230 $59,650 $127,910
California $112,390 $79,900 $148,760
Colorado $101,940 $78,990 $140,230
Connecticut $98,190 $63,000 $128,500
Delaware $96,160 $60,710 $125,800
District of Columbia $97,220 $72,010 $129,840
Florida $96,010 $66,640 $111,740
Georgia $101,290 $69,140 $124,120
Hawaii $100,320 $75,980 $112,960
Idaho $87,170 $61,790 $114,160
Illinois $97,040 $66,340 $130,060
Indiana $86,440 $61,940 $111,720
Iowa $83,260 $64,470 $109,220
Kansas $94,340 $61,940 $120,910
Kentucky $82,760 $65,730 $110,700
Louisiana $95,230 $61,370 $124,800
Maine $79,700 $62,240 $100,480
Maryland $100,430 $72,620 $128,160
Massachusetts $95,830 $63,530 $119,250
Michigan $82,970 $60,030 $102,600
Minnesota $84,850 $64,160 $101,520
Mississippi $94,990 $65,780 $113,800
Missouri $87,060 $64,820 $107,770
Montana $84,970 $68,470 $107,790
Nebraska $84,850 $67,920 $106,870
Nevada $101,510 $65,690 $148,310
New Hampshire $87,530 $61,630 $112,930
New Jersey $104,570 $60,530 $148,140
New Mexico $96,870 $64,440 $138,940
New York $101,840 $64,170 $158,080
North Carolina $91,100 $61,810 $112,170
North Dakota $78,280 $66,940 $103,010
Ohio $90,520 $54,580 $121,620
Oklahoma $99,530 $67,790 $125,500
Oregon $102,400 $79,600 $120,990
Pennsylvania $92,660 $66,540 $123,540
Rhode Island $97,560 $70,590 $119,930
South Carolina $91,620 $59,340 $113,370
South Dakota $79,980 $66,080 $98,730
Tennessee $94,750 $70,810 $115,080
Texas $98,970 $72,120 $132,460
Utah $85,750 $48,880 $110,560
Vermont $83,730 $64,650 $107,430
Virginia $98,510 $73,770 $135,240
Washington $100,250 $78,630 $128,720
West Virginia $86,450 $49,360 $122,560
Wisconsin $82,720 $63,130 $103,870
Wyoming $83,740 $63,720 $110,560

Source: U.S. Bureau of Labor Statistics (BLS) 2023 median salary; projected job growth through 2032. Actual salaries may vary depending on location, level of education, years of experience, work environment, and other factors. Salaries may differ even more for those who are self-employed or work part time.

What’s Next?


Physical Therapists

Occupational Therapists

  • Seek certification from the American Board of Physical Therapy Specialties after meeting clinical practice requirements by working with patients in a specialty area, such as:
  • Geriatrics
  • Neurology
  • Orthopedics
  • Pediatrics
  • Sports
  • Women’s health
  • OTs can seek board certification in gerontology, mental health, pediatrics, or physical rehabilitation after meeting clinical practice requirements; or specialty certification in:
  • Driving
  • Community mobility
  • Environment modification
  • Low vision
  • Feeding, eating, swallowing
  • School systems

In some cases, patients start out with a physical therapist then move on to an occupational therapist. One example: Someone recovering from a stroke might work with a physical therapist to build back muscle strength. Later on, that person would see an occupational therapist to work on buttoning a shirt, using the restroom or taking a shower.

If you’re interested in either career, there are entry-level educational and career options. Find out more about what it takes to become a physical therapy assistant or an occupational therapy assistant.